KANO MODEL is a simple model whose inputs can be used to create and measure software quality.
The concept of Kano model arrives from the fact that a product evolves in this way
Core Product -> Generic Product -> Expected Product -> Augmented Product -> Potential Product (See below)
In this evolution process a measurement of quality is traditionally one dimensional. For Example Performance is “Goodß or à Bad “ or Customer Satisfaction is High or Low etc
Kano model tries to evaluate quality on the basis of 2 dimensions. It broadly translates to 3 important types of features
1> Basic or Must Be or the Dissatisfier -> Features customers will not tell us unless something is missing or wrongly done. Product comparison is not done here, if a feature is missing customers will not even consider this product. This is a POP (Point of Parity) area.
2> Performance -> This is where customers speak most and compare products. All traditional models use this approach only.
3> Excitement/Delighters -> Customers do not talk about this, and are mostly unaware of such features. This is where demos can delight a customer and in turn make it a competitive advantage over other products. This is what we can call POD(Points of Differentiation)
4> Dislike -> Some stuffs we can do without
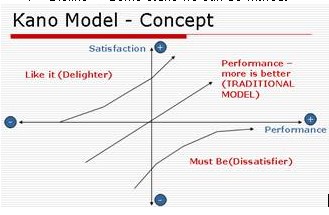
There is another important thing to note. A must be (Dissatisfier or hygiene) factor is noticeable only till a certain point, beyond which there is no use of improving the feature because customer satisfaction doesn’t improve much. However in case of a Delighter beyond a certain point the customer satisfaction increases exponentially.
The fun part of this is that most features evolve as a delighter, over time become a performance metric and before the next year becomes a Must Be. Software Products and features are copied too easily and too fast. A POD can be easily copied or substituted to a POP where it yields no more advantage to the company.
Using responses from a focus group or a complete survey one can clearly figure out the details of a product.
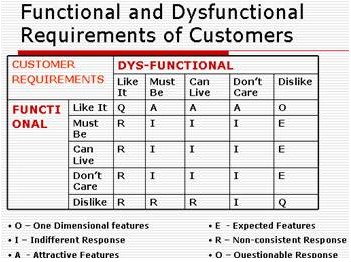
We can find out how satisfied or dissatisfied a customer is using these equations’
• Users’ satisfaction coefficients = (A + O) / Total responses
• Users’ dissatisfaction coefficients = (O + E)/ Total responses
These results can be carried on further to create a QFD and measure detailed aspects of quality. But that is another story.
Liked this article. Explains in a subtle and neat manner! way to go!!
ReplyDelete